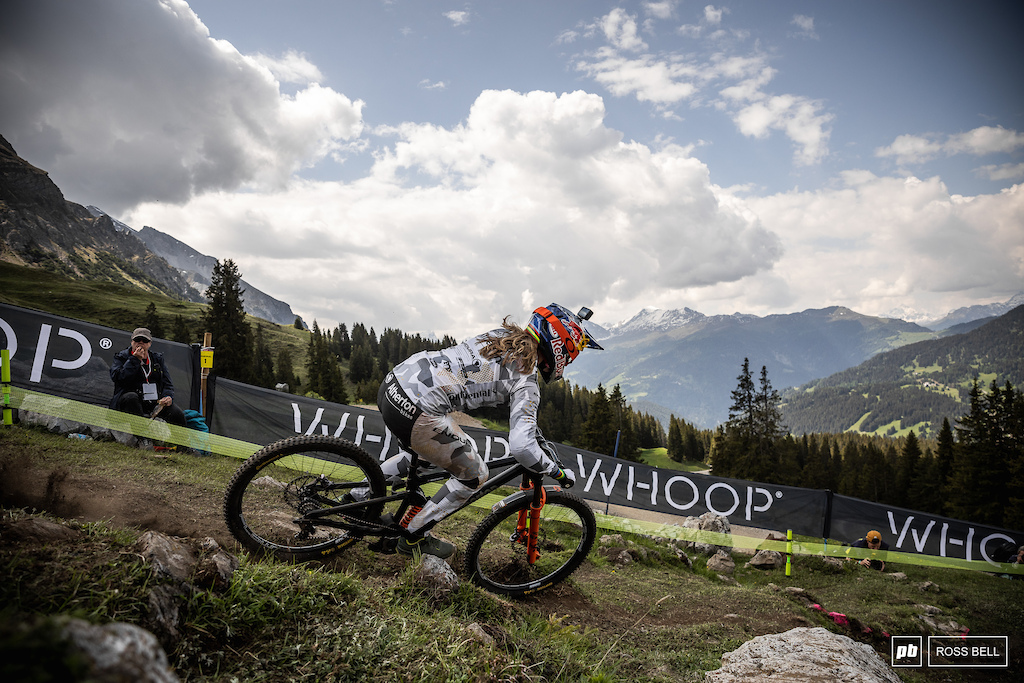
The flat-out and dusty course in Lenzerheide delivered the good with some of the best racing we have seen in years. As the dust settles in Switzerland it is the British riders Rachel Atherton and Jordan Williams who came out on top, but who else was performing well at the World Cup opening round in Lenzerheide?
After a historic day of racing let’s get into the results and stats.
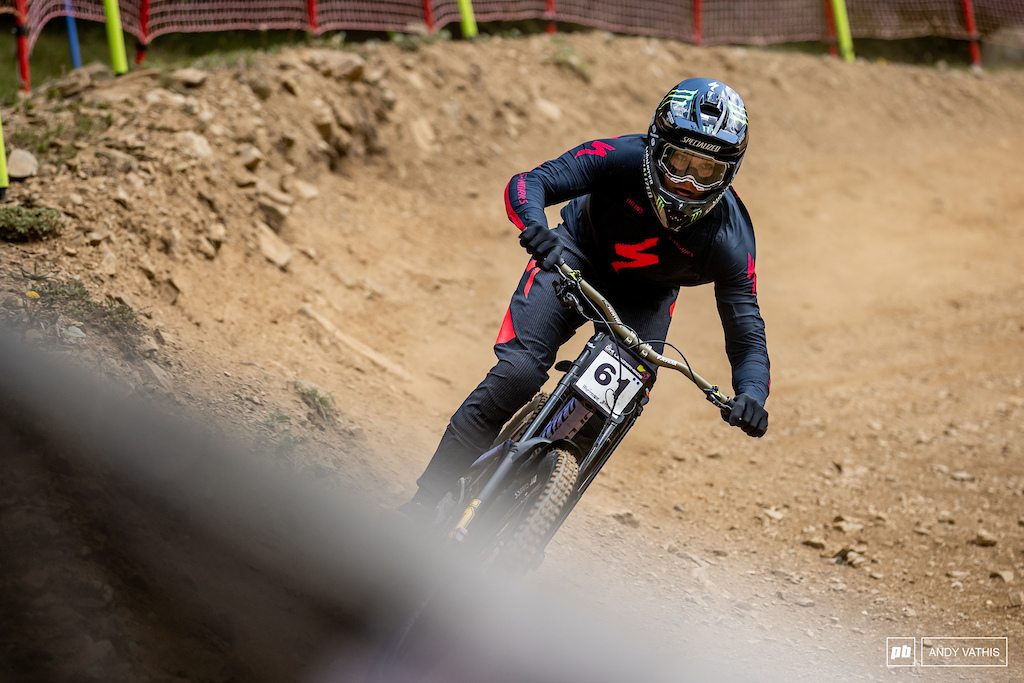
1st. Rachel Atherton: 3:07.514
2nd. Camille Balanche: 3:08.048
3rd. Nina Hoffmann: 3:08.301
4th. Vali Höll: 3:09.270
5th. Marine Cabirou: 3:11.118
1st. Jordan Williams: 2:39.222
2nd. Loris Vergier: 2:39.717
3rd. Loic Bruni: 2:39.907
4th. Laurie Greenland: 2:40.058
5th. Finn Iles: 2:40.232
Full results, here.
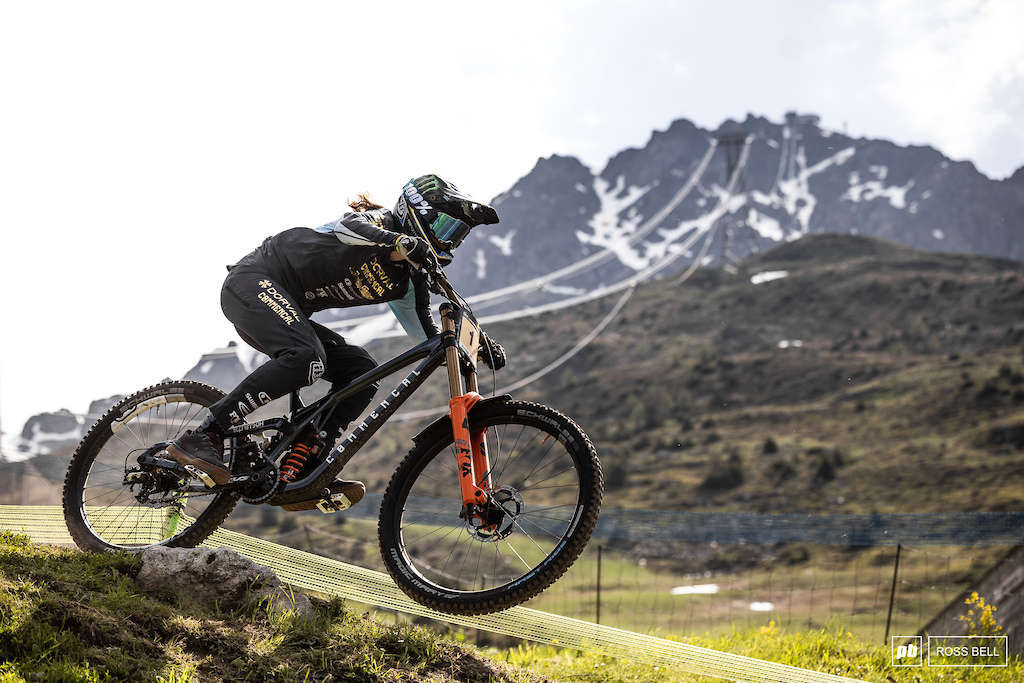
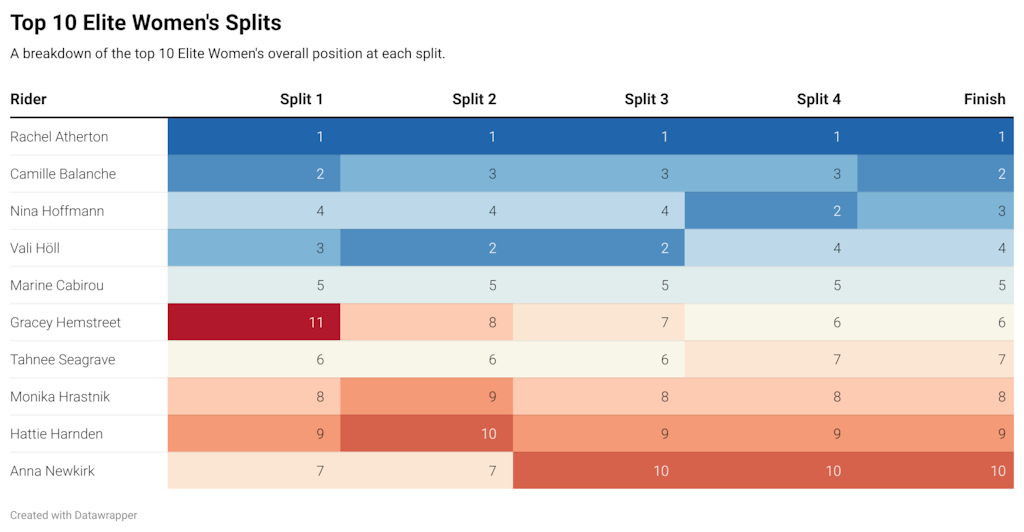
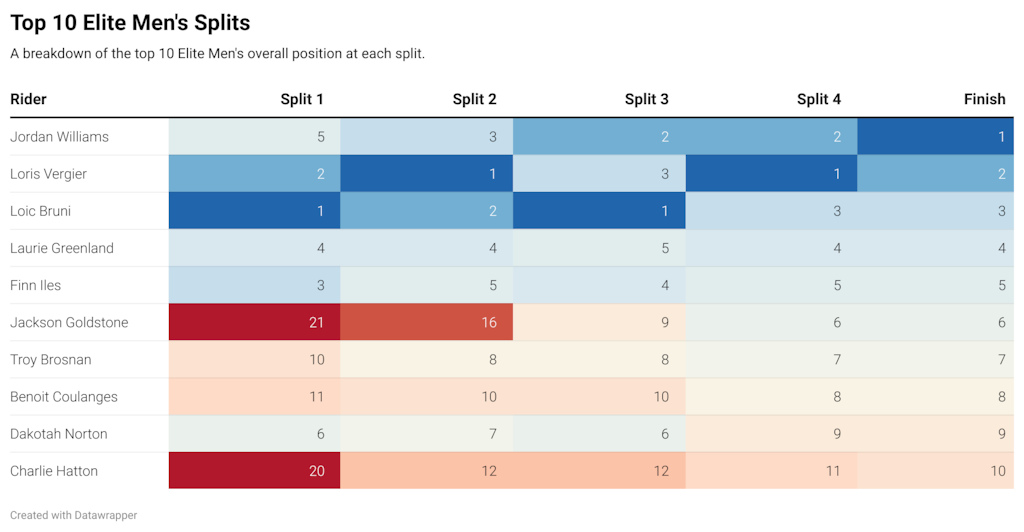
Overall Split Positions
Sector 1
1st. Rachel Atherton: 49.303
2nd. Camille Balanche: 50.380
3rd. Vali Höll: 50.765
4th. Nina Hoffmann: 51.214
5th. Marine Cabirou: 52.445
Sector 2
1st. Rachel Atherton: 1:34.267
2nd. Vali Höll: 1:36.367
3rd. Camille Balanche: 1:36.653
4th. Nina Hoffmann: 1:36.694
5th. Marine Cabirou: 1:39.492
Sector 3
1st. Rachel Atherton: 2:03.349
2nd. Vali Höll: 2:04.675
3rd. Camille Balanche: 2:05.301
4th. Nina Hoffmann: 2:05.515
5th. Marine Cabirou: 2:07.957
Sector 4
1st. Rachel Atherton: 2:42.740
2nd. Nina Hoffmann: 2:43.437
3rd. Camille Balanche: 2:43.458
4th. Vali Höll: 2:43.840
5th. Marine Cabirou: 2:46.000
Finish
1st. Rachel Atherton: 3:07.514
2nd. Camille Balanche: 3:08.048
3rd. Nina Hoffmann: 3:08.301
4th. Vali Höll: 3:09.270
5th. Marine Cabirou: 3:11.118
Sector 1
1st. Loic Bruni: 43.625
2nd. Loris Vergier: 43.873
3rd. Finn Iles: 44.173
4th. Laurie Greenland: 44.308
5th. Jordan Williams: 44.397
Sector 2
1st. Loris Vergier: 1:21.892
2nd. Loic Bruni: 1:22.242
3rd. Jordan Williams: 1:22.295
4th. Laurie Greenland: 1:22.382
5th. Finn Iles: 1:22.485
Sector 3
1st. Loic Bruni: 1:45.336
2nd. Jordan Williams: 1:45.819
3rd. Loris Vergier: 1:46.025
4th. Finn Iles: 1:46.114
5th. Laurie Greenland: 1:46.233
Sector 4
1st. Loris Vergier: 2:17.471
2nd. Jordan Williams: 2:17.472
3rd. Loic Bruni: 2:17.688
4th. Laurie Greenland: 2:18.039
5th. Finn Iles: 2:18.135
Finish
1st. Jordan Williams: 2:39.222
2nd. Loris Vergier: 2:39.717
3rd. Loic Bruni: 2:39.907
4th. Laurie Greenland: 2:40.058
5th. Finn Iles: 2:40.232
Split Rankings
Unlike previous years results for each individual split have not been published on the UCI site following the race. As there are now only 10 women and 30 men in finals we have done the calculations and tried to break down who was fastest at each split.
Sector 1
1st. Rachel Atherton: 49.303
2nd. Camille Balanche: 50.380
3rd. Vali Höll: 50.765
4th. Nina Hoffmann: 51.214
5th. Marine Cabirou: 52.445
Sector 2
1st. Rachel Atherton: 44.964
2nd. Nina Hoffmann: 45.480
3rd. Vali Höll: 45.602
4th. Gracey Hemstreet: 46.160
5th. Camille Balanche: 46.273
Sector 3
1st. Vali Höll: 28.308
2nd. Marine Cabirou: 28.465
3rd. Camille Balanche: 28.648
4th. Gracey Hemstreet: 28.801
5th. Nina Hoffmann: 28.821
Sector 4
1st. Gracey Hemstreet: 37.719
2nd. Nina Hoffmann: 37.922
3rd. Marine Cabirou: 38.043
4th. Camille Balanche: 38.157
5th. Vali Höll: 39.165
Final Split to Finish
1st. Gracey Hemstreet: 24.411
2nd. Camille Balanche: 24.590
3rd. Tahnee Seagrave: 24.727
4th. Rachel Atherton: 24.774
5th. Nina Hoffmann: 24.864
Sector 1
1st. Loic Bruni: 43.625
2nd. Loris Vergier: 43.873
3rd. Finn Iles: 44.173
4th. Laurie Greenland: 44.308
5th. Jordan Williams: 44.397
Sector 2
1st. Jordan Williams: 37.898
2nd. Loris Vergier: 38.019
3rd. Laurie Greenland: 38.074
4th. Finn Iles: 38.312
5th. Angel Suarez: 38.597
Sector 3
1st. Loic Bruni: 23.094
2nd. Jackson Goldstone: 23.297
3rd. Jordan Williams: 23.524
4th. Tuhoto-Ariki Pene: 23.551
5th. Finn Iles: 23.629
Sector 4
1st. Loris Veriger: 31.446
2nd. Jordan Williams: 31.653
3rd. Laurie Greenland: 31.806
4th. Jackson Goldstone: 31.809
5th. Finn Iles: 32.021
Final Split to Finish
1st. Jordan Williams: 21.75
2nd. Jackson Goldstone: 21.762
3rd. Laurie Greenland: 22.019
4th. Tuhoto-Ariki Pene: 22.04
5th. Danny Hart: 22.086
Elite Women
Elite Men
Elite Women
The Perfect Run: 3:04.705 (2.809 seconds faster than the race winner)
//Rachel Atherton: 49.303 // Rachel Atherton: 44.964 // Vali Höll: 28.308 // Gracey Hemstreet: 37.719 // Gracey Hemstreet: 24.411 //
Elite Men
The Perfect Run: 2:37.813 (1.409 seconds faster than the race winner)
//Loic Bruni: 43.625 // Jordan Williams: 37.898 // Loic Bruni: 23.094 // Loris Veriger: 31.446 // Jordan Williams: 21.75 //
All 11 Elite Women’s race runs were plotted.
The top 15 race runs were plotted before including results at positions 20, 25 and 30
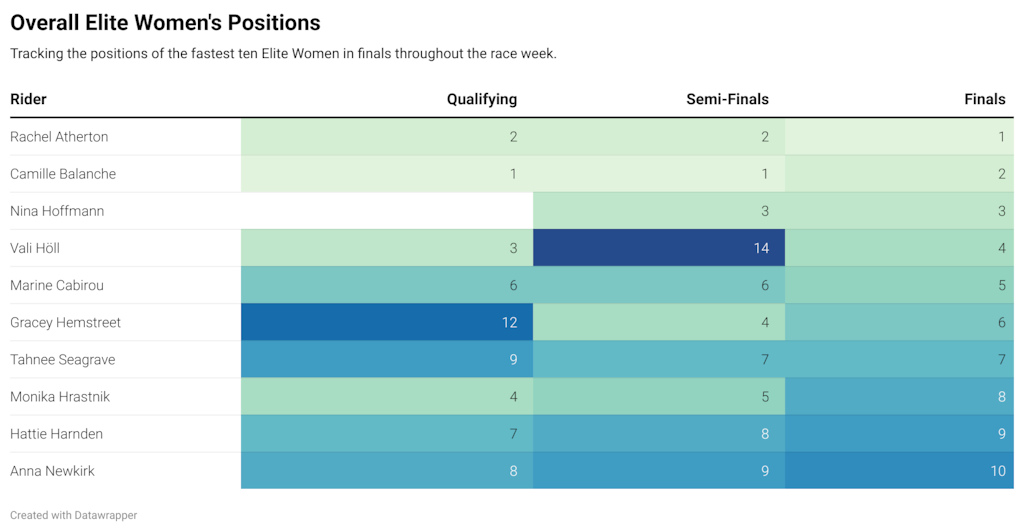
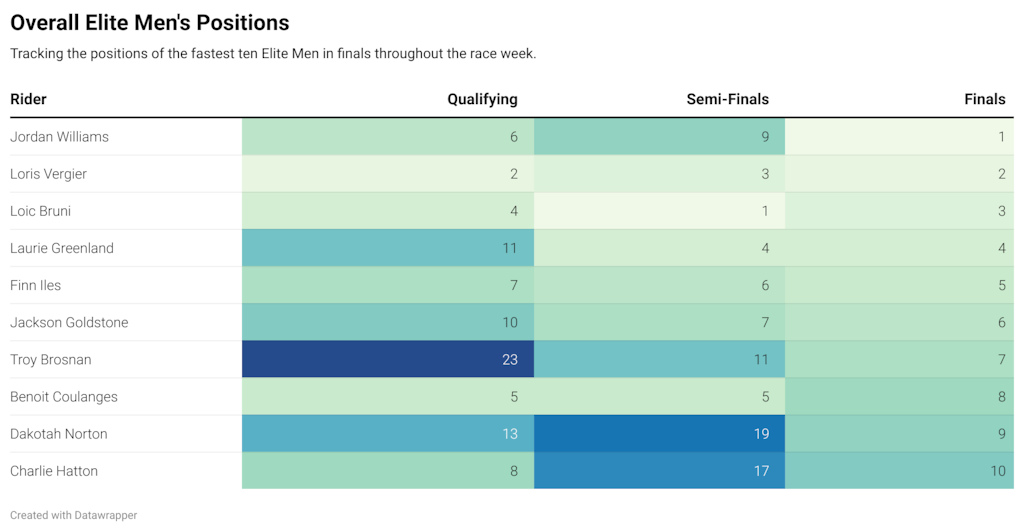
You can hover over the graph to reveal the lap improvement times.
You can hover over the graph to reveal the lap improvement times.
