
Leogang delivered another incredible day of racing as the second round of the 2023 downhill World Cup series wraps up in Austria. As the dust settles in Leogang it was Vali Höll and Andreas Kolb who came out on top taking their first home World Cup wins (a first-ever win for Kolb). The racing was flat-out and rowdy but apart from the winning riders who else was performing well at round two?
After a hectic day of racing let’s get into the results and stats.
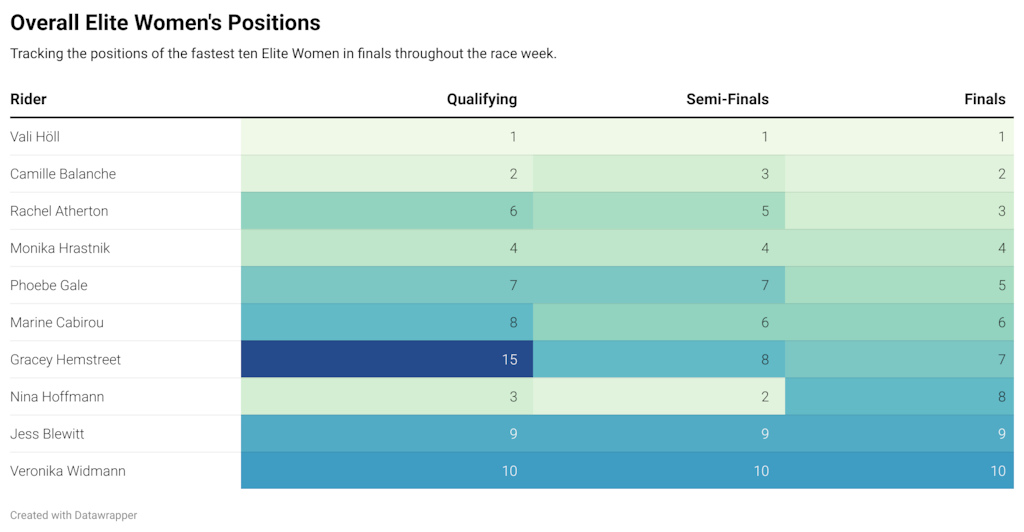
Elite Women
1st. Vali Höll: 3:23.222
2nd. Camille Balanche: 3:27.525
3rd. Rachel Atherton: 3:30.556
4th. Monika Hrastnik: 3:30.825
5th. Phoebe Gale: 3:31.074
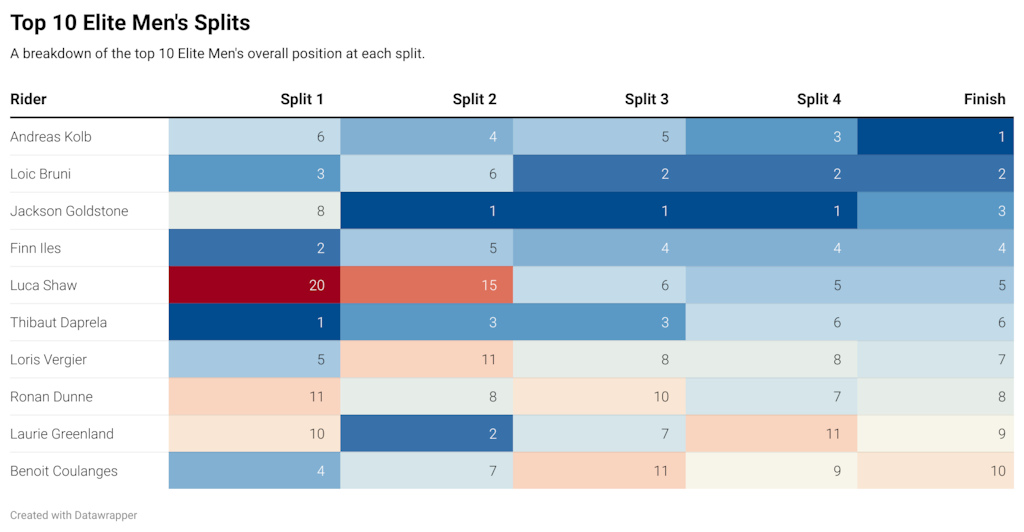
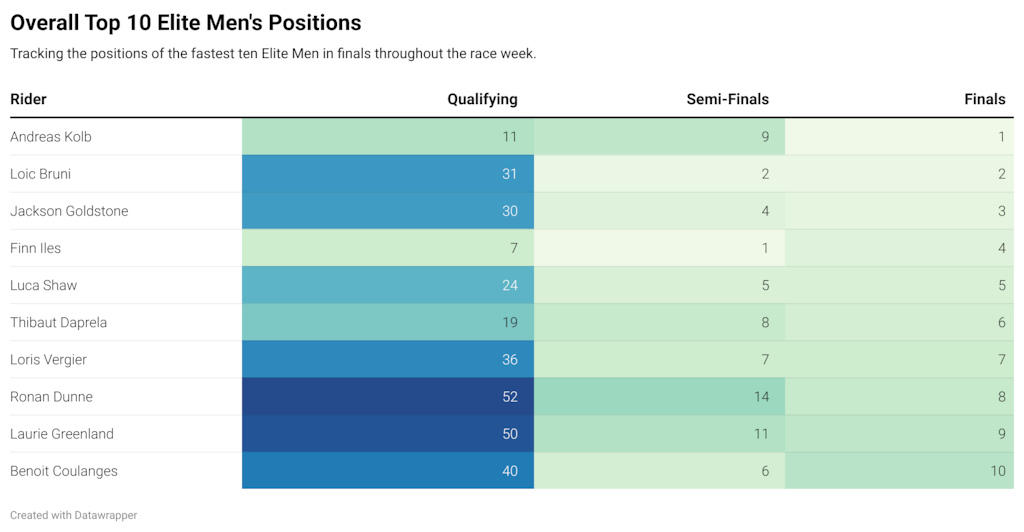
Elite Men
1st. Andreas Kolb: 2:59.335
2nd. Loic Bruni: 3:00.015
3rd. Jackson Goldstone: 3:00.246
4th. Finn Iles: 3:00.786
5th. Luca Shaw: 3:01.048
Full results, here.
Overall Split Positions
Sector 1
1st. Vali Höll: 36.720
2nd. Nina Hoffmann: 37.234
3rd. Rachel Atherton: 37.269
4th. Camille Balanche: 37.590
5th. Marine Cabirou: 38.648
Sector 2
1st. Vali Höll: 1:27.316
2nd. Camille Balanche: 1:29.064
3rd. Nina Hoffmann: 1:29.185
4th. Rachel Atherton: 1:29.185
5th. Monika Hrastnik: 1:31.665
Sector 3
1st. Vali Höll: 2:07.367
2nd. Nina Hoffmann: 2:09.908
3rd. Camille Balanche: 2:10.733
4th. Rachel Atherton: 2:11.276
5th. Phoebe Gale: 2:12.888
Sector 4
1st. Vali Höll: 2:48.774
2nd. Camille Balanche: 2:52.241
3rd. Rachel Atherton: 2:53.038
4th. Marine Cabirou: 2:55.182
5th. Phoebe Gale: 2:55.595
Finish
1st. Vali Höll: 3:23.222
2nd. Camille Balanche: 3:27.525
3rd. Rachel Atherton: 3:30.556
4th. Monika Hrastnik: 3:30.825
5th. Phoebe Gale: 3:31.074
Sector 1
1st. Thibaut Daprela: 32.450
2nd. Finn Iles: 32.652
3rd. Loic Bruni: 32.740
4th. Benoit Coulanges: 32.808
5th. Loris Vergier: 32.908
Sector 2
1st. Jackson Goldstone: 1:16.929
2nd. Laurie Greenland: 1:17.567
3rd. Thibaut Daprela: 1:17.631
4th. Andreas Kolb: 1:17.647
5th. Finn Iles: 1:17.732
Sector 3
1st. Jackson Goldstone: 1:54.868
2nd. Loic Bruni: 1:54.996
3rd. Thibaut Daprela: 1:55.018
4th. Finn Iles: 1:55.326
5th. Andreas Kolb: 1:55.343
Sector 4
1st. Jackson Goldstone: 2:28.614
2nd. Loic Bruni: 2:29.008
3rd. Andreas Kolb: 2:29.195
4th. Finn Iles: 2:29.455
5th. Luca Shaw: 2:30.237
Finish
1st. Andreas Kolb: 2:59.335
2nd. Loic Bruni: 3:00.015
3rd. Jackson Goldstone: 3:00.246
4th. Finn Iles: 3:00.786
5th. Luca Shaw: 3:01.048
Split Rankings
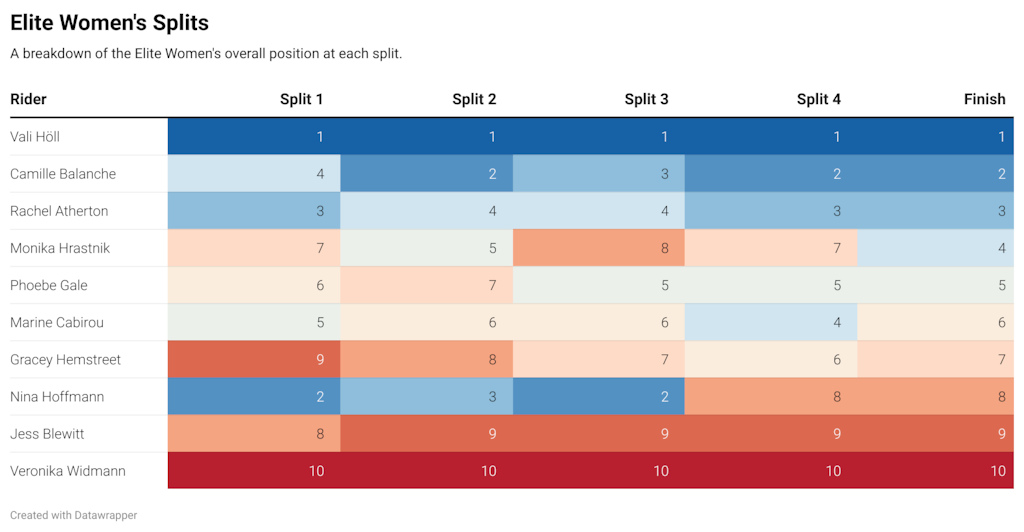
Unlike previous years results for each individual split have not been published on the UCI site following the race. As there are now only 10 women and 30 men in finals we have done the calculations and tried to break down who was fastest at each split.
Sector 1
1st. Vali Höll: 36.720
2nd. Nina Hoffmann: 37.234
3rd. Rachel Atherton: 37.269
4th. Camille Balanche: 37.590
5th. Marine Cabirou: 38.648
Sector 2
1st. Vali Höll: 50.596
2nd. Camille Balanche: 51.474
3rd. Rachel Atherton: 51.916
4th. Nina Hoffmann: 51.951
5th. Gracey Hemstreet: 52.618
Sector 3
1st. Vali Höll: 40.051
2nd. Nina Hoffmann: 40.723
3rd. Phoebe Gale: 40.817
4th. Camille Balanche: 41.669
5th. Marine Cabirou: 41.782
Sector 4
1st. Vali Höll: 41.407
2nd. Camille Balanche: 41.508
3rd. Gracey Hemstreet: 41.609
4th. Marine Cabirou: 41.641
5th. Rachel Atherton: 41.762
Final Split to Finish
1st. Monika Hrastnik: 34.444
2nd. Vali Höll: 34.448
3rd. Camille Balanche: 35.284
4th. Rachel Atherton: 37.518
5th. Nina Hoffmann: 45.209
Sector 1
1st. Thibaut Daprela: 32.450
2nd. Finn Iles: 32.652
3rd. Loic Bruni: 32.740
4th. Benoit Coulanges: 32.808
5th. Loris Vergier: 32.908
Sector 2
1st. Jackson Goldstone: 43.907
2nd. Laurie Greenland: 44.38
3rd. Andreas Kolb: 44.7
4th. Loic Bruni: 45.068
5th. Finn Iles: 45.08
Sector 3
1st. Luca Shaw: 36.61
2nd. Loic Bruni: 37.188
3rd. Tuhoto-Ariki Pene: 37.333
4th. Thibaut Daprela: 37.387
5th. Bernard Kerr: 37.403
Sector 4
1st. Jackson Goldstone: 33.746
2nd. Andreas Kolb: 33.852
3rd. Loic Bruni: 34.012
4th. Ronan Dunne: 34.129
5th. Finn Iles: 34.129
Final Split to Finish
1st. Andreas Kolb: 30.14
2nd. Matt Walker: 30.581
3rd. Laurie Greenland: 30.64
4th. Charlie Hatton: 30.659
5th. Loris Vergier: 30.694
Elite Women
Elite Men
Elite Women
The Perfect Run: 3:23.218 (0.004 seconds faster than the race winner)
//Vali Höll: 36.720 // Vali Höll: 50.596 // Vali Höll: 40.051 // Vali Höll: 41.407 // Monika Hrastnik: 34.444 //
Elite Men
The Perfect Run: 2:56.853 (2.482 seconds faster than the race winner)
//Thibaut Daprela: 32.450 // Jackson Goldstone: 43.907 // Luca Shaw: 36.61 // Jackson Goldstone: 33.746 // Andreas Kolb: 30.14 //

Split 5 is the sector between the fourth split and the finish line.
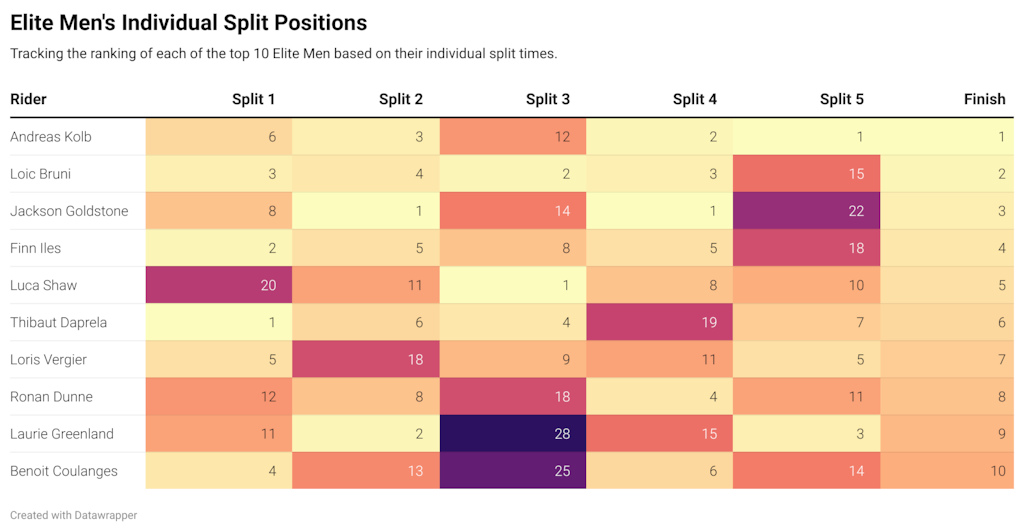
Split 5 is the sector between the fourth split and the finish line.
You can use the drop-down menu to view each rider’s times.
You can use the drop-down menu to view each rider’s times.
All 10 Elite Women’s race runs were plotted.
The top 15 race runs were plotted before including results at positions 20, 25 and 29
You can hover over the graph to reveal the lap improvement times.
You can hover over the graph to reveal the lap improvement times.